
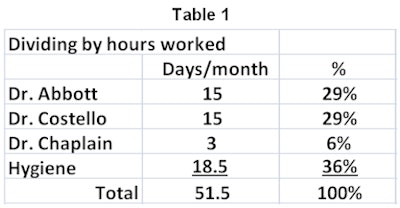
Our next method of assigning expenses to determine the profitability of each provider team is based on hours worked by each team. We are looking to handle dentists evenly, avoiding the "punishment" of higher production/collection with a heavier load of expenses. To determine individual profitability, we will use the following breakdown:
 Jill Nesbitt, MBA.
Dr. Abbott and Dr. Costello are working the same number of days this month, and Dr. Chaplain ends up with three eight-hour days (all days in the table above are eight-hour days) over the course of the month. Our hygiene team has the most hours worked since they spread their time across every open hour of the practice.
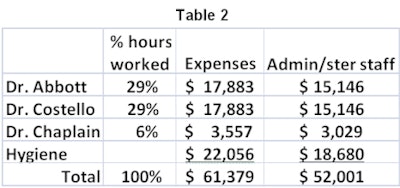
To determine the allocation of expenses, administration, sterilization, and so on, we use the percentages above against total expense and calculate dental supplies against production. Since our hygienist team works the most hours each month, they also carry most of the weight of these shared costs.
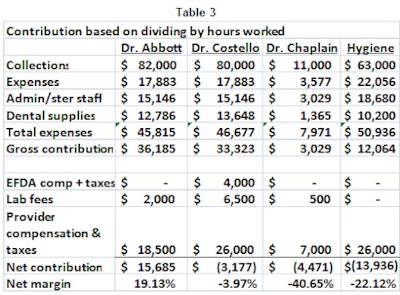
Calculating profitability based on this approach, Dr. Abbott once again comes out far ahead. This is less because of his "true" contribution than to not working with an expanded functions dental auxilliary (EFDA) and incurring lower lab fees and salary for the month. All three of our other provider teams fall into the red.
 Thomas Climo, PhD.
From an owner's perspective, does this approach provide the correct information for management? Table 3 shows that the hygienist team lost $13,936 when they enjoyed their most productive month of the year to date which seems wrong, if not upside down.
Dr. Chaplain still appears to be losing money for the group when, intuitively we know this just cannot be the case as he covered one of the satellite practices just the other week when a dentist called off -- salvaging 75% of that day's production thanks to working 8 a.m. to 1 p.m.
Finally, looking at our two high-producing dentists, we are starting to have a clearer picture of how extra staff and lab expense on top of a $7,500 salary differential marks the difference between positive and negative contribution -- even when we're thrilled at the high level of production.
Divided by collection
Next, profitability based on collection. This method focuses on the significance and importance of cash flow. Most practices operating at a 98% collection rate will not observe substantial differences in results from the divided by production approach. In our example, hygienists end up at the exact same percentage, while our full-time dentists flip position with Dr. Abbott having a slightly higher ratio.
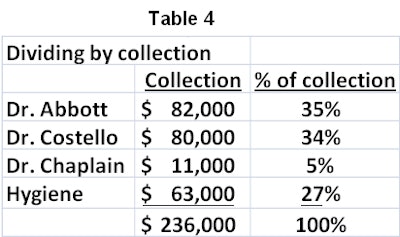
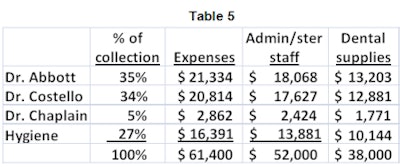
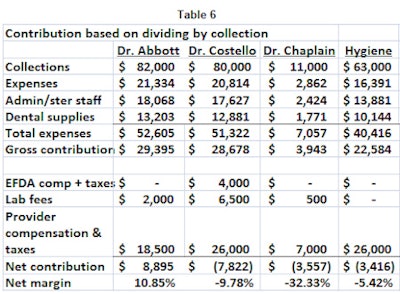
We continue to allocate our dental supplies based on production percentage, but the other expenses and administrative and sterilization staff compensation will vary based on the provider team's collections compared with total revenue for the practice in the month. In this final approach, Dr. Abbott continues to come out ahead, even though he is carrying slightly more of the expenses than Dr. Costello. The rest of our provider teams are at a loss, but these can be explained rationally in comparison to the other providers.
There is an additional factor to consider if selecting this calculation for your group practice. The front desk team and business support staff are responsible for collections and insurance follow-up. If this system is failing, although the dentists are producing at reasonable levels, it could cause discrepancies in collections outside the dentist's control.
You may also be less inclined to select this option if one of the dentists in your group is paid primarily by medical insurance. In today's world of sleep apnea and temporomandibular joint (TMJ) appliances, medical insurance can take upwards of 90 days to process, and if your provider is waiting on these payments, his collections will reflect closer to a 75% rate rather than the 98% benchmark for the industry. This doesn't automatically eliminate this option as a viable one for evaluating profitability, but it may suggest a reconsideration of your financial policy to bring your collections ratios closer together.
In the next part of the series, we'll discuss the idea of dividing by production.
Thomas Climo, PhD, is a financial consultant with offices in Las Vegas and Melville, NY. He was a tenured professor of economics at a major university in England and currently handles the dental practice management/dental service organization (DPM/DSO) framework for more than a dozen solo practitioner dentists in 10 states, each with multiple facility practices. He can be reached by phone at 702-578-2757 or by email at [email protected].
Jill Nesbitt, MBA, is a dental group practice management consultant operating from Nashville, TN, who was for more than 15 years a practice administrator for a large single-office dental group in central Ohio and now serves as the chief operating officer for a multilocation group. She can be reached by phone at 615-970-8405 or by email at [email protected].
The comments and observations expressed herein do not necessarily reflect the opinions of DrBicuspid.com, nor should they be construed as an endorsement or admonishment of any particular idea, vendor, or organization.

